
Power data, finally clear.
Whether you're an energy consultant, a utility, or an end consumer — anyone who wants to understand power data knows the problem: spreadsheets, slow scripts, countless manual steps. TEELS replaces the handwork with a tool built by specialists, for specialists — tuned for efficiency.
Understanding, not a data graveyard
Every electricity meter logs a reading every fifteen minutes — about 35,000 rows per meter per year. Too much for a spreadsheet, too fiddly for a quick script: the information inside never gets used. TEELS turns the raw data into a readable picture in seconds — for anyone who wants to act on power data.
Your data, from every angle.
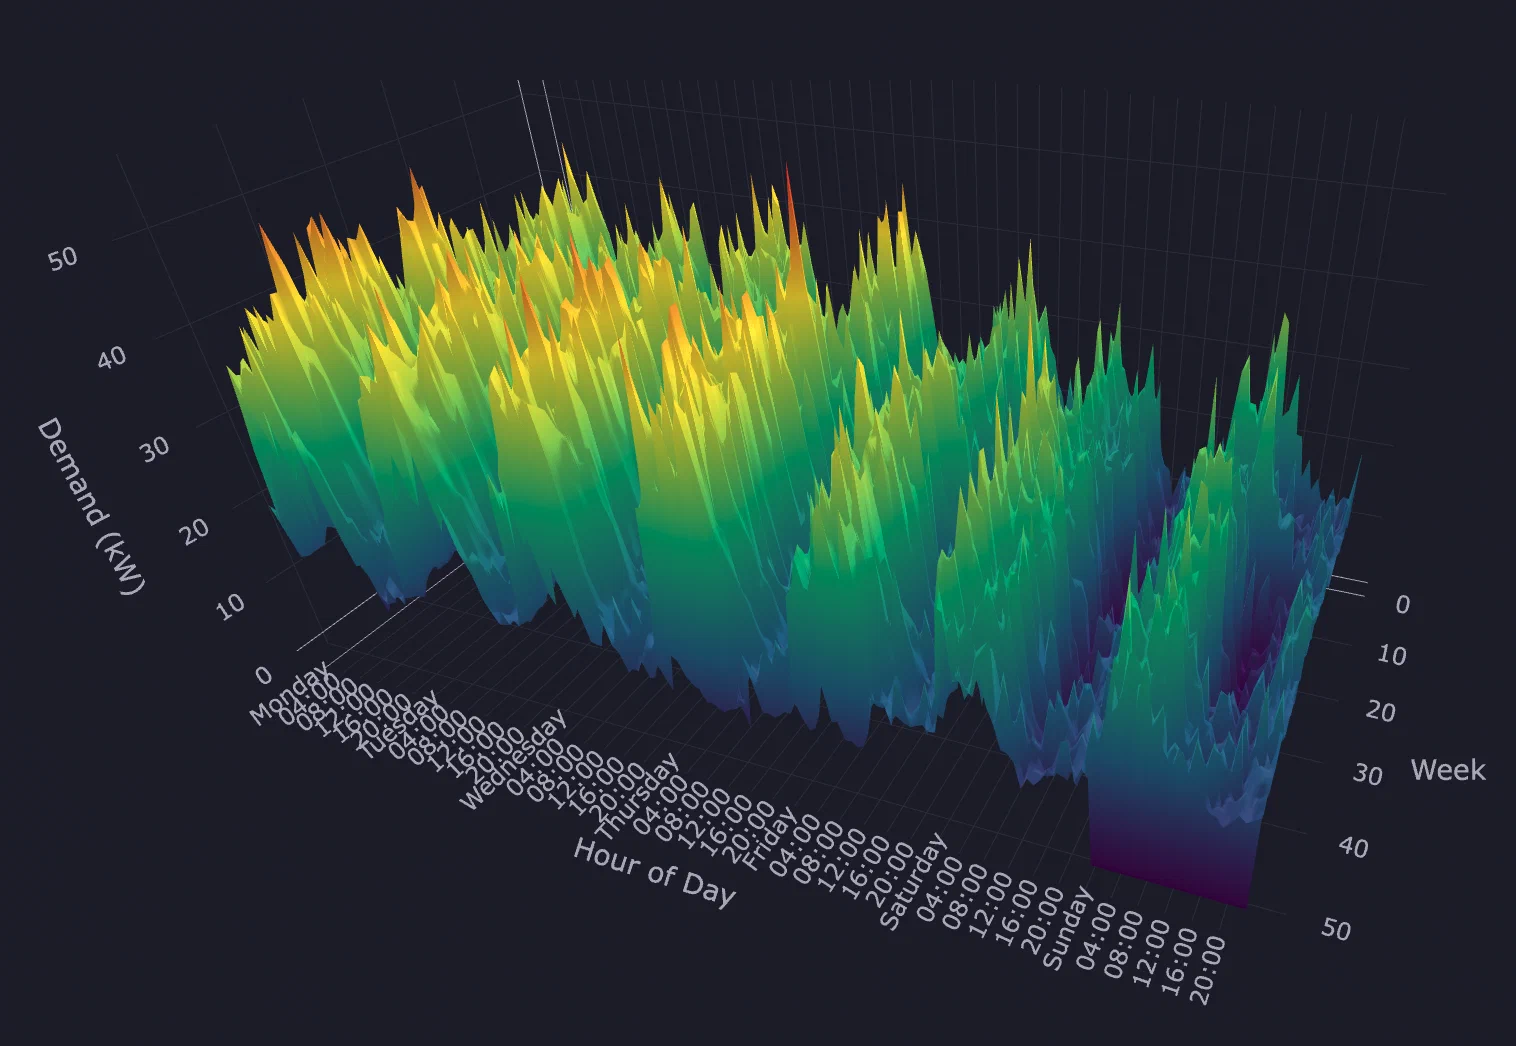
3D visualisation
A whole year as an interactive 3D landscape.
Four steps from raw data to a client report.
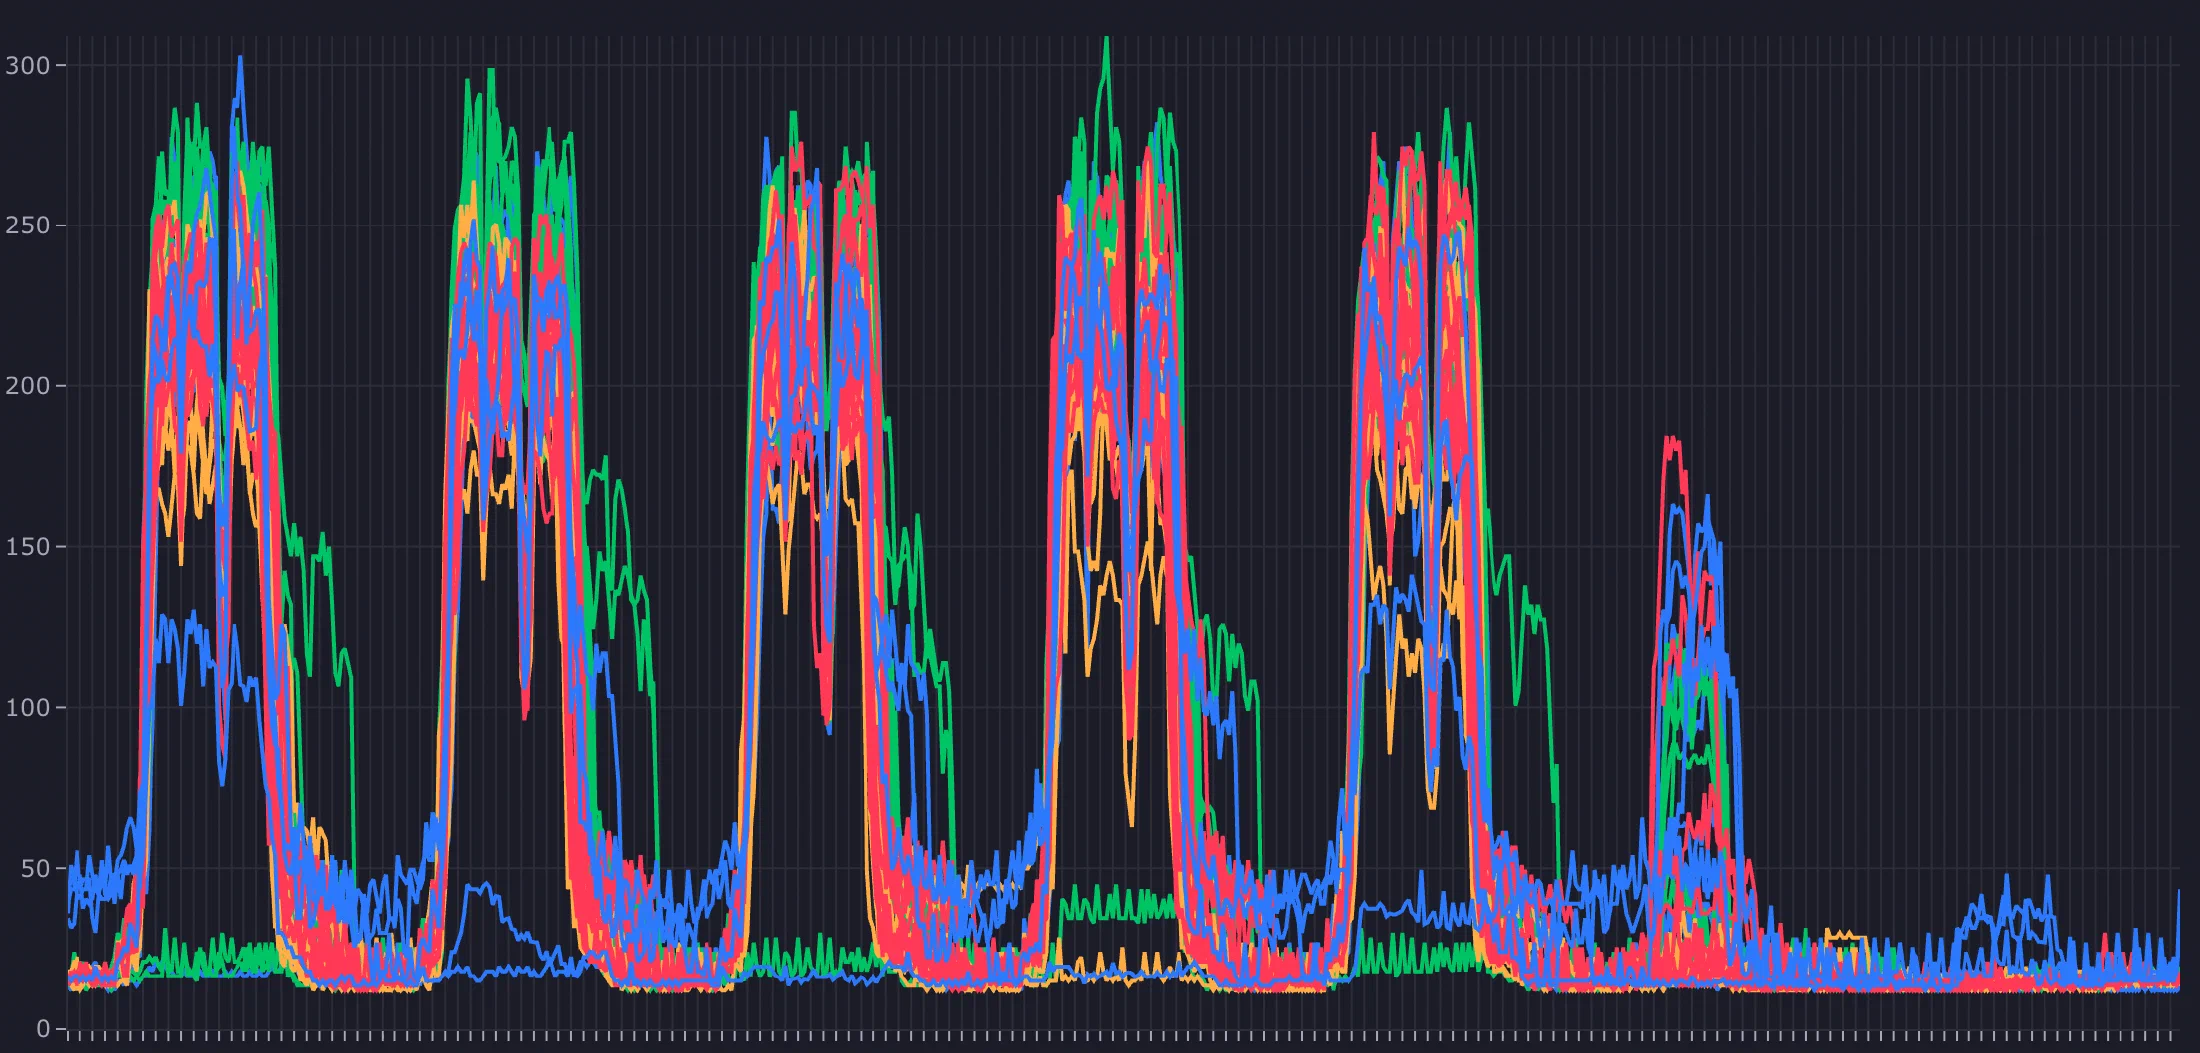
From 35,000 rows to a meaningful, interactive chart.
Why not just an AI?
Because 35,000 readings per meter per year are not a language problem. A language model phrases things differently on every run and fills gaps instead of showing them. TEELS calculates by fixed rules. If a customer questions a figure six months later, the same data still produces the same result — along with the rule it was calculated by. And if you do want to use an AI: through the MCP interface it works on the prepared figures instead of the raw export.
- No cloud AI — your load data stays where it is
- Same data, same result — a year from now too
- Gaps stay gaps instead of being plausibly filled
- MCP: your own AI, on clean figures instead of raw rows
Built for everyone who wants to understand their power data.
A clear data foundation for every client analysis.
Understand your own data, kick off optimisations and track the results.
Your own analysis tool, or a branded customer portal.
Clearly laid-out data from all your sites.
Interested?
Try the demo, or get in touch — no strings attached.